The Top 10 Fastest and Slowest Metros for Internet
May 17, 2021 | Share ![]()
![]()
![]()
Industry Exclusive/Entertainment
According to our recent analysis, the average internet speed in the largest 100 metros in the US is 89.3 Mbps. But the difference between the fastest and slowest metros is a whopping 96.4 Mbps.
If you’re running into trouble with slow speeds for remote work, streaming, or online gaming, you could find the fastest internet provider in your area. But you might have better luck moving to a new metro with faster internet.
We analyzed the 100 largest metros in the US (according to FCC data) and found the fastest and slowest average internet speeds across the US.1 Metros include multiple cities, and some even cross state lines—this gives a broader view of big cities and their internet speed.
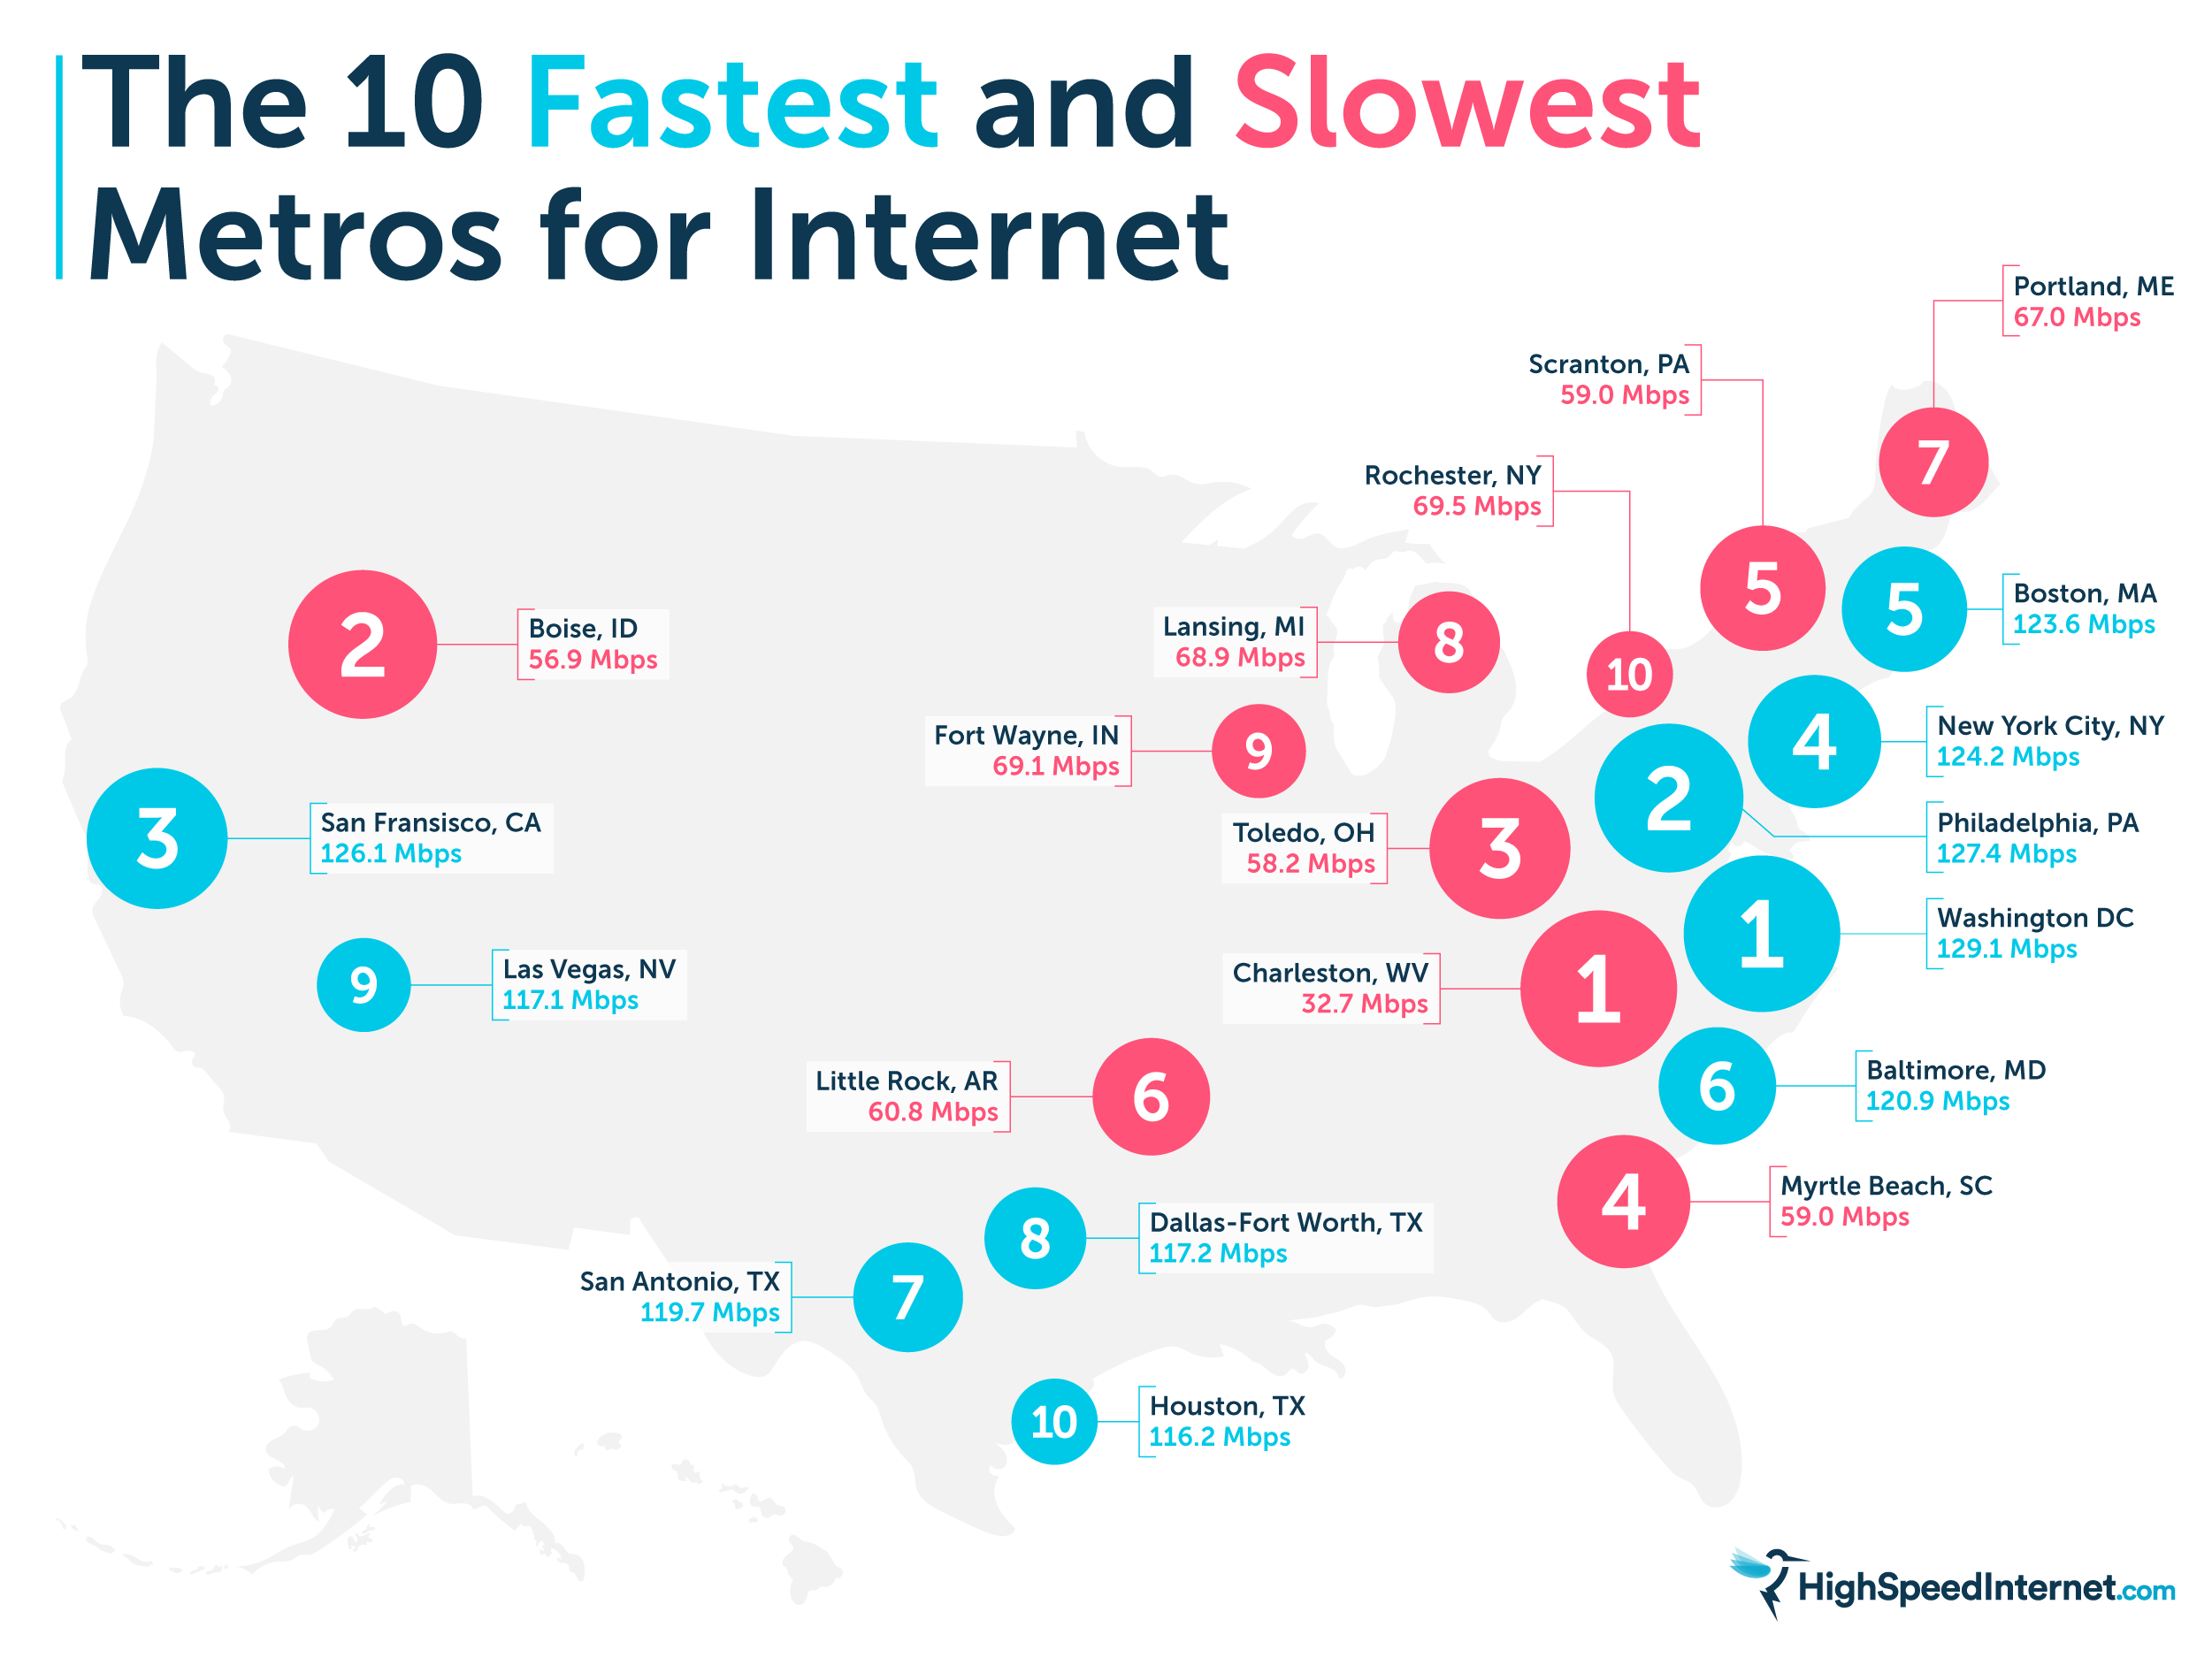
Washington, DC, tops the list with an average download speed of 129.1 Mbps—that’s almost 40 Mbps faster than the average internet speed in the largest 100 metros. DC’s speeds are nearly four times those of the slowest metro: Charleston, West Virginia.
A total of 37 metros had average download speeds of over 100 Mbps, and six metros averaged over 120 Mbps. We also provided a ranking for median download speeds, which may represent what the “average person” has in a metro; mean speeds appear faster because the average includes people who have very fast internet speeds that could be 10 times faster.
The top 10 metros with the fastest internet speeds
| Mean average speed rank | Metro | Mean download speed (Mbps) | Median download speed (Mbps) | Median download speed rank |
|---|---|---|---|---|
| 1 | Washington, DC | 129.1 | 72.1 | 3 |
| 2 | Philadelphia, Pennsylvania | 127.4 | 73.9 | 1 |
| 3 | San Francisco, California | 126.1 | 67.4 | 6 |
| 4 | New York City, New York | 124.2 | 72.5 | 2 |
| 5 | Boston, Massachusettstts | 123.6 | 71.6 | 4 |
| 6 | Baltimore, Maryland | 120.9 | 65.6 | 7 |
| 7 | San Antonio, Texas | 119.7 | 65.1 | 8 |
| 8 | Dallas-Ft. Worth, Texas | 117.2 | 62.2 | 14 |
| 9 | Las Vegas, Nevada | 117.1 | 58 | 26 |
| 10 | Houston, Texas | 116.2 | 58.3 | 23 |
-
Fastest metro area
 Fastest Advertised Speeds in Washington, DCVerizon
- Advertised download speeds up to 2048 Mbps
- 5G Home, DSL & Fiber
-
Fastest Advertised Speeds in Philadelphia, PAVerizon
- Advertised download speeds up to 2048 Mbps
- 5G Home, DSL & Fiber
-
 Fastest Advertised Speeds in San Francisco, CAAT&T
- Advertised download speeds up to 5000 Mbps
- DSL & Fiber
The top 10 metros with the slowest internet speed
| Mean average speed rank | Metro | Mean download speed (Mbps) | Median download speed (Mbps) | Median download speed rank |
|---|---|---|---|---|
| 1 | Charleston, West Virginia | 32.7 | 7.5 | 3 |
| 2 | Boise, Idaho | 56.9 | 18 | 1 |
| 3 | Toledo, Ohio | 58.2 | 32.4 | 6 |
| 4 | Myrtle Beach, South Carolina | 59 | 18.1 | 2 |
| 5 | Scranton, Pennsylvania | 59 | 18.1 | 4 |
| 6 | Little Rock, Arkansas | 60.8 | 23 | 7 |
| 7 | Portland, Maine | 67 | 38.9 | 8 |
| 8 | Lansing, Michigan | 68.9 | 28.2 | 14 |
| 9 | Fort Wayne, Indiana | 69.1 | 27.4 | 26 |
| 10 | Rochester, New York | 69.5 | 35.6 | 23 |
Charleston had the slowest speeds by far out of the 100 largest metros, coming in at 32.7 Mbps. The next slowest was Boise, Idaho, with 56.9 Mbps. Only 38 of the 100 largest metros fell below the nationwide average of 89.3 Mbps.
But over the past 12 months, internet speeds seem to be improving—sometimes dramatically—across the board. Speeds increased along with the needs of the pandemic—more people worked from home, did remote schooling, accessed healthcare, and stayed home for entertainment.
When we look at median speeds, which may better represent what speeds the average person has in an area, we can see New York City went from a median of 57.5 Mbps to 79.94 Mbps, jumping over 20 Mbps within a year.
What changed from our previous fastest and slowest internet speed report?
In our 2020 internet speed report for cities (not metros), we clocked the fastest internet speeds in Whitestone, New York (138.4 Mbps), and the slowest internet speeds in Stowe, Vermont (7.3 Mbps).
Metros contain several cities, so our 2021 report shows more balanced average download speeds. The fastest cities are now included with slower surrounding areas and vice versa.
If you want to live near a major city without paying downtown prices, you can find the internet speeds you need in every major metro in the US.
| Mean Speed Ranked | Metro | Mean Download Speed (Mbps) | Median Download Speed (Mbps) | # of Speed Tests | Median Speed Ranked (Mbps) |
|---|---|---|---|---|---|
| 1 | Washington DC | 127.4 | 73.9 | 32,492 | 1 |
| 2 | Philadelphia, Pennsylvania | 126.1 | 67.4 | 40,000 | 5 |
| 4 | San Francisco, California | 124.2 | 72.5 | 79,700 | 2 |
| 4 | New York City, New York | 123.6 | 71.6 | 32,837 | 3 |
| 5 | Boston, Massachusetts | 120.9 | 65.6 | 15,832 | 6 |
| 6 | Baltimore, Maryland | 119.7 | 65.1 | 9,827 | 7 |
| 7 | San Antonio, Texas | 117.2 | 62.2 | 43,549 | 13 |
| 8 | Dallas-Ft. Worth, Texas | 117.1 | 58 | 8,876 | 25 |
| 9 | Las Vegas, Nevada | 116.2 | 58.3 | 42,655 | 22 |
| 10 | Houston, Texas | 115.7 | 63.4 | 12,835 | 10 |
| 11 | Nashville, Tennessee | 115.4 | 59.4 | 3,195 | 18 |
| 12 | Huntsville, Alabama | 114.2 | 57 | 44,733 | 27 |
| 13 | Atlanta, Georgia | 114.1 | 61.4 | 13,537 | 14 |
| 14 | Pittsburgh, Pennsylvania | 114 | 62.6 | 5,686 | 11 |
| 15 | Virginia Beach, Virginia | 112.9 | 58.7 | 53,754 | 21 |
| 16 | Miami, Florida | 112.7 | 68.5 | 29,846 | 4 |
| 17 | Riverside, California | 111.8 | 51.8 | 5,595 | 35 |
| 18 | Sacramento, California | 111.7 | 60.4 | 20,117 | 16 |
| 19 | San Jose, California | 111.3 | 58.8 | 11,462 | 20 |
| 20 | Jacksonville, Florida | 111.2 | 54.9 | 33,697 | 29 |
| 21 | Seattle, Washington | 111 | 64.2 | 13,502 | 9 |
| 22 | Charlotte, North Carolina | 110.8 | 65.1 | 85,317 | 8 |
| 23 | Los Angeles, California | 110.8 | 58.9 | 9,494 | 19 |
| 24 | Raleigh, North Carolina | 107.9 | 57 | 4,114 | 28 |
| 25 | Springfield, Massachusetts | 107.3 | 60.8 | 2,674 | 15 |
| 26 | Chattanooga, Tennessee | 106.3 | 48 | 20,962 | 52 |
| 27 | Portland, Oregon | 106.2 | 47.8 | 6,154 | 53 |
| 28 | Colorado Springs, Colorado | 106.1 | 51.6 | 24,070 | 36 |
| 29 | Denver, Colorado | 105.1 | 59.7 | 4,309 | 17 |
| 30 | Ogden-Clearfield, Utah | 104.6 | 62.6 | 8,870 | 12 |
| 31 | North Port, Florida | 104.3 | 51.8 | 63,305 | 34 |
| 32 | Austin, Texas | 104.2 | 48.7 | 4,270 | 46 |
| 33 | Chicago, Illinois | 104.1 | 47.6 | 4,002 | 54 |
| 34 | Oklahoma City, Oklahoma | 102.3 | 57.2 | 945 | 26 |
| 35 | Greenville, South Carolina | 101.2 | 48.6 | 7,964 | 47 |
| 35 | Indianapolis, Indiana | 101.2 | 48.6 | 7,964 | 47 |
| 37 | Kansas City, Kansas | 100.6 | 45.5 | 4,879 | 62 |
| 38 | Harrisburg, Pennsylvania | 99.9 | 54.7 | 4,285 | 30 |
| 39 | El Paso, Texas | 99 | 50.1 | 2,320 | 38 |
| 40 | Savannah, Georgia | 97.5 | 49 | 28,364 | 43 |
| 40 | Detroit, Michigan | 97.5 | 49 | 28,364 | 43 |
| 42 | Phoenix, Arizona | 96.2 | 47.1 | 10,046 | 55 |
| 43 | Salt Lake City, Utah | 95.9 | 48.1 | 5,311 | 51 |
| 44 | Louisville, Kentucky | 95.6 | 45.6 | 3,364 | 61 |
| 45 | Omaha, Nebraska | 95.1 | 42.5 | 1,773 | 65 |
| 46 | Wichita, Kansas | 94.8 | 58.1 | 27,204 | 23 |
| 46 | Minneapolis, Minnesota | 94.8 | 58.1 | 27,204 | 23 |
| 48 | Orlando, Florida | 94.7 | 46.8 | 7,609 | 56 |
| 49 | Milwaukee, Wisconsin | 94.2 | 48.6 | 11,554 | 49 |
| 50 | Cincinatti, Ohio | 94.1 | 45.7 | 1,922 | 59 |
| 51 | Baton Rouge, Louisiana | 94 | 49.6 | 4,847 | 39 |
| 52 | Charleston, South Carolina | 92.9 | 52.4 | 2,724 | 33 |
| 53 | Syracuse, New York | 92.1 | 48.9 | 2,652 | 45 |
| 54 | Augusta, Georgia | 92 | 43.3 | 4,899 | 64 |
| 55 | Tucson, Arizona | 91.9 | 49.6 | 13,498 | 40 |
| 56 | St. Louis, Missouri | 91.5 | 49.3 | 3,040 | 42 |
| 57 | Bakersfield, California | 91.3 | 46.6 | 5,259 | 57 |
| 58 | Provo-Orem, Utah | 91.1 | 41.5 | 10,313 | 69 |
| 59 | Hartford, Connecticut | 90.6 | 42 | 2,281 | 67 |
| 60 | South Bend, Indiana | 90 | 49.5 | 4,267 | 41 |
| 61 | Greensboro, North Carolina | 89.3 | 45.6 | 3,484 | 60 |
| 62 | New Orleans, Louisiana | 88.1 | 38.2 | 2,790 | 78 |
| 63 | Tulsa, Oklahoma | 88 | 53.1 | 6,502 | 31 |
| 64 | Palm Bay, Florida | 87.5 | 39.1 | 9,194 | 74 |
| 65 | Cape Coral, Florida | 87.2 | 40.4 | 3,687 | 71 |
| 66 | Lancaster, Pennsylvania | 86.4 | 38 | 2,013 | 80 |
| 67 | Fayetteville, North Carolina | 85.8 | 36.9 | 3,946 | 82 |
| 68 | Spokane, Washington | 85.4 | 52.7 | 2,562 | 32 |
| 69 | Reno, Nevada | 84.8 | 40.9 | 6,264 | 70 |
| 70 | Allentown, Pennsylvania | 84.5 | 35.5 | 3,775 | 84 |
| 70 | Birmingham, Alabama | 84.5 | 35.5 | 3,775 | 84 |
| 70 | Fresno, California | 84.5 | 35.5 | 3,775 | 84 |
| 73 | Memphis, Tennessee | 83.9 | 42.3 | 7,112 | 66 |
| 74 | Grand Rapids, Michigan | 83.4 | 48.5 | 3,975 | 50 |
| 75 | Albany, New York | 83 | 44.9 | 4,699 | 63 |
| 76 | Dayton, Ohio | 81.2 | 41.6 | 2,399 | 68 |
| 77 | Asheville, North Carolina | 81.2 | 38.7 | 12,515 | 76 |
| 78 | Columbus, Ohio | 81 | 45.9 | 4,845 | 58 |
| 79 | Buffalo, New York | 80.1 | 37 | 1,678 | 81 |
| 80 | Mobile, Alabama | 79.9 | 40.1 | 3,971 | 72 |
| 81 | Columbia, South Carolina | 79.4 | 50.6 | 3,357 | 37 |
| 82 | Urban Honolulu, Hawaii | 78.4 | 34.3 | 4,338 | 88 |
| 83 | Madison, Wisconsin | 78.3 | 39.2 | 2,788 | 73 |
| 84 | Lexington, Kentucky | 76.6 | 38.1 | 1,316 | 79 |
| 85 | Lafayette, Louisiana | 76.3 | 38.2 | 10,852 | 77 |
| 86 | Cleveland, Ohio | 75.6 | 32.9 | 3,086 | 89 |
| 87 | Des Moines, Iowa | 71.6 | 28.4 | 7,413 | 91 |
| 88 | Albuquerque, New Mexico | 70.8 | 34.9 | 2,561 | 87 |
| 89 | Youngstown, Ohio | 69.5 | 35.6 | 6,894 | 83 |
| 90 | Rochester, New York | 69.1 | 27.4 | 4,504 | 93 |
| 91 | Fort Wayne, Indiana | 68.9 | 28.2 | 3,477 | 92 |
| 92 | Lansing, Michigan | 67 | 38.9 | 2,947 | 75 |
| 93 | Portland, Maine | 60.8 | 23 | 4,817 | 94 |
| 94 | Little Rock, Arkansas | 59 | 18.1 | 5,258 | 95 |
| 94 | Myrtle Beach, South Carolina | 59 | 18.1 | 5,258 | 95 |
| 96 | Toledo, Ohio | 58.2 | 32.4 | 2,150 | 90 |
| 97 | Boise, Idaho | 56.9 | 18 | 3,815 | 97 |
| 98 | Charleston, West Virginia | 32.7 | 7.5 | 2,270 | 98 |
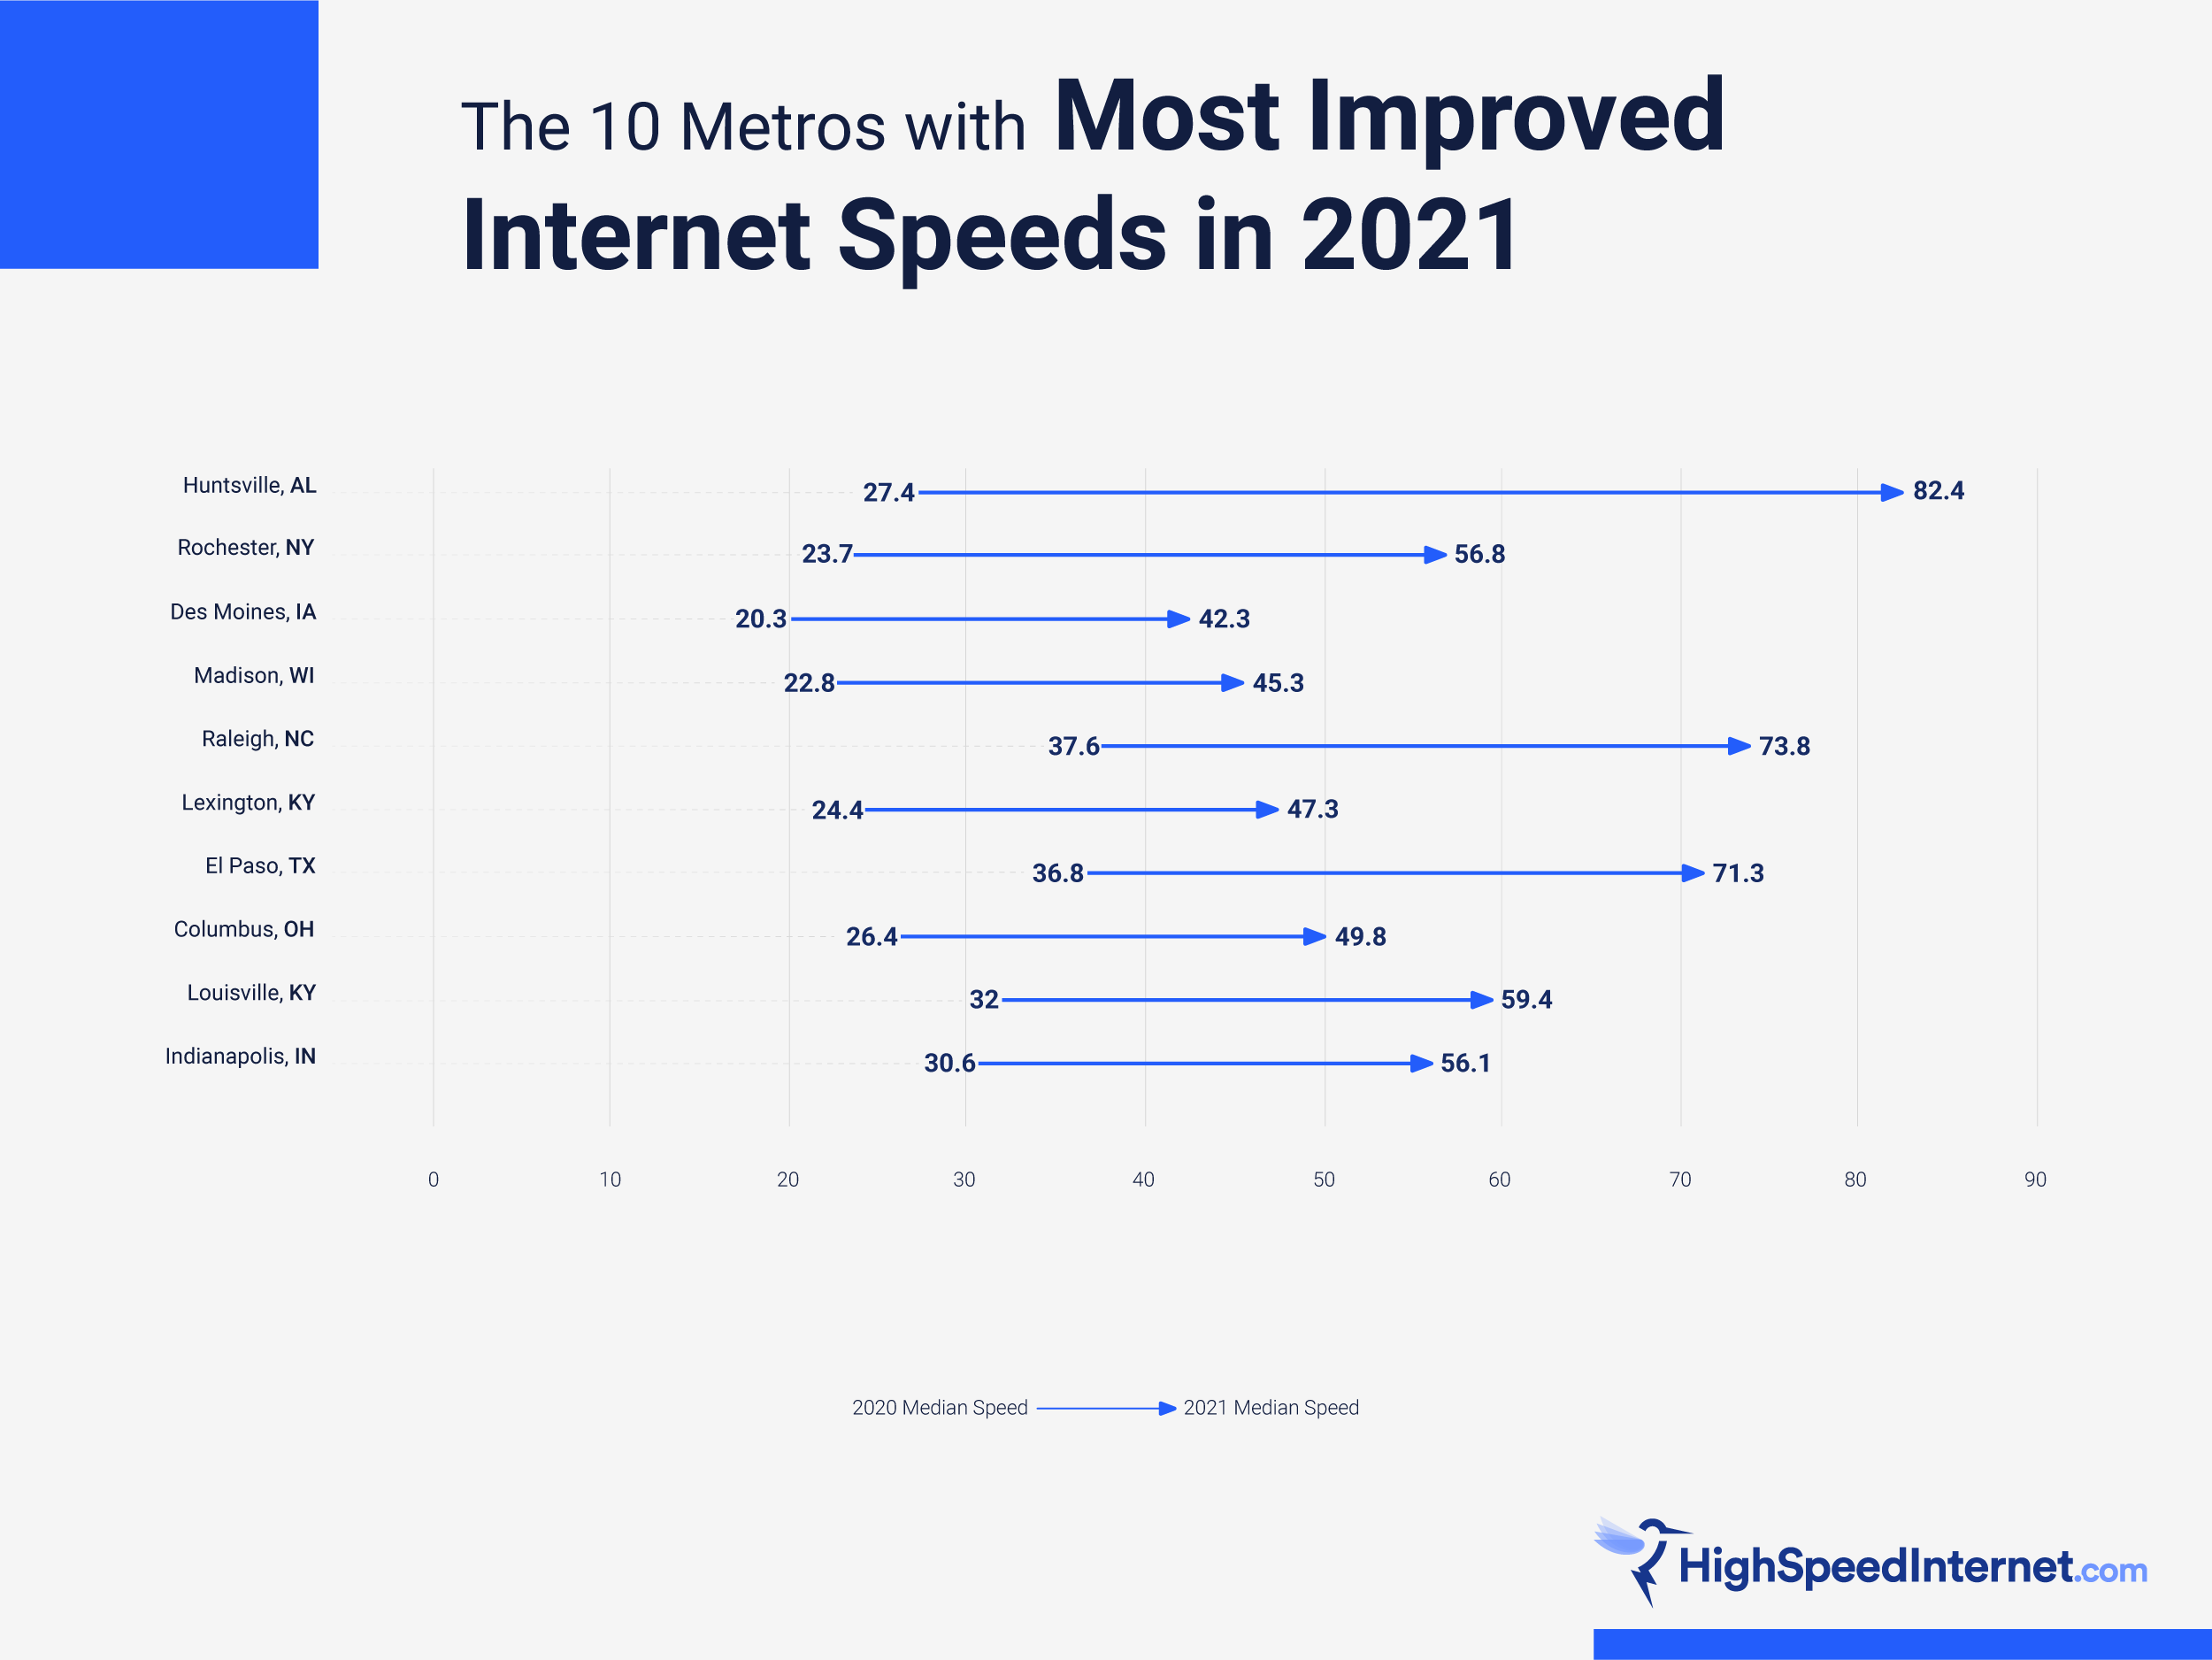
The 10 Metros with the Most (and Least) Improved Internet Speeds
In the Appalachian city of Huntsville, Alabama, internet speeds rocketed up a full 200% from February 2020 to February 2021—median speeds went from 27 Mbps to 82 Mbps. Rochester, New York, also saw a huge boost in speeds during that time, rising by nearly 140% from 23 Mbps to 56 Mbps.
Five other cities saw internet connections double or nearly double in speed, including Des Moines, Iowa; and Madison, Wisconsin.
| Metro Area | Median download speed in Q1 of 2020 (Mbps) | Median download speed in Q1 of 2021 (Mbps) | Change in download speeds from Q1 of 2020 to Q1 of 2021 (%) |
|---|---|---|---|
| 1. Huntsville, Alabama | 27.4 | 82.4 | 200.70% |
| 2. Rochester, New York | 23.7 | 56.8 | 139.70% |
| 3. Des Moines Iowa | 20.3 | 42.3 | 108.40% |
| 4. Madison, Wisconsin | 22.8 | 45.3 | 98.70% |
| 5. Raleigh, North Carolina | 37.6 | 73.8 | 96.30% |
| 6. Lexington, Kentucky | 24.4 | 47.3 | 93.90% |
| 7. El Paso, Texas | 36.8 | 71.3 | 93.80% |
| 8. Columbus, Ohio | 26.4 | 49.8 | 88.60% |
| 9. Louisville, Kentucky | 32 | 59.4 | 85.60% |
| 10. Indianapolis, Indiana | 30.6 | 56.1 | 83.30% |
| Metro Area | 1. Huntsville, Alabama |
| Median download speed in Q1 of 2020 (Mbps) | 27.4 |
| Median download speed in Q1 of 2021 (Mbps) | 82.4 |
| Change in download speeds from Q1 of 2020 to Q1 of 2021 (%) | 200.70% |
| Metro Area | 2. Rochester, New York |
| Median download speed in Q1 of 2020 (Mbps) | 23.7 |
| Median download speed in Q1 of 2021 (Mbps) | 56.8 |
| Change in download speeds from Q1 of 2020 to Q1 of 2021 (%) | 139.70% |
| Metro Area | 3. Des Moines Iowa |
| Median download speed in Q1 of 2020 (Mbps) | 20.3 |
| Median download speed in Q1 of 2021 (Mbps) | 42.3 |
| Change in download speeds from Q1 of 2020 to Q1 of 2021 (%) | 108.40% |
| Metro Area | 4. Madison, Wisconsin |
| Median download speed in Q1 of 2020 (Mbps) | 22.8 |
| Median download speed in Q1 of 2021 (Mbps) | 45.3 |
| Change in download speeds from Q1 of 2020 to Q1 of 2021 (%) | 98.70% |
| Metro Area | 5. Raleigh, North Carolina |
| Median download speed in Q1 of 2020 (Mbps) | 37.6 |
| Median download speed in Q1 of 2021 (Mbps) | 73.8 |
| Change in download speeds from Q1 of 2020 to Q1 of 2021 (%) | 96.30% |
| Metro Area | 6. Lexington, Kentucky |
| Median download speed in Q1 of 2020 (Mbps) | 24.4 |
| Median download speed in Q1 of 2021 (Mbps) | 47.3 |
| Change in download speeds from Q1 of 2020 to Q1 of 2021 (%) | 93.90% |
| Metro Area | 7. El Paso, Texas |
| Median download speed in Q1 of 2020 (Mbps) | 36.8 |
| Median download speed in Q1 of 2021 (Mbps) | 71.3 |
| Change in download speeds from Q1 of 2020 to Q1 of 2021 (%) | 93.80% |
| Metro Area | 8. Columbus, Ohio |
| Median download speed in Q1 of 2020 (Mbps) | 26.4 |
| Median download speed in Q1 of 2021 (Mbps) | 49.8 |
| Change in download speeds from Q1 of 2020 to Q1 of 2021 (%) | 88.60% |
| Metro Area | 9. Louisville, Kentucky |
| Median download speed in Q1 of 2020 (Mbps) | 32 |
| Median download speed in Q1 of 2021 (Mbps) | 59.4 |
| Change in download speeds from Q1 of 2020 to Q1 of 2021 (%) | 85.60% |
| Metro Area | 10. Indianapolis, Indiana |
| Median download speed in Q1 of 2020 (Mbps) | 30.6 |
| Median download speed in Q1 of 2021 (Mbps) | 56.1 |
| Change in download speeds from Q1 of 2020 to Q1 of 2021 (%) | 83.30% |
The 10 Metros with the Least Improved Internet Speeds
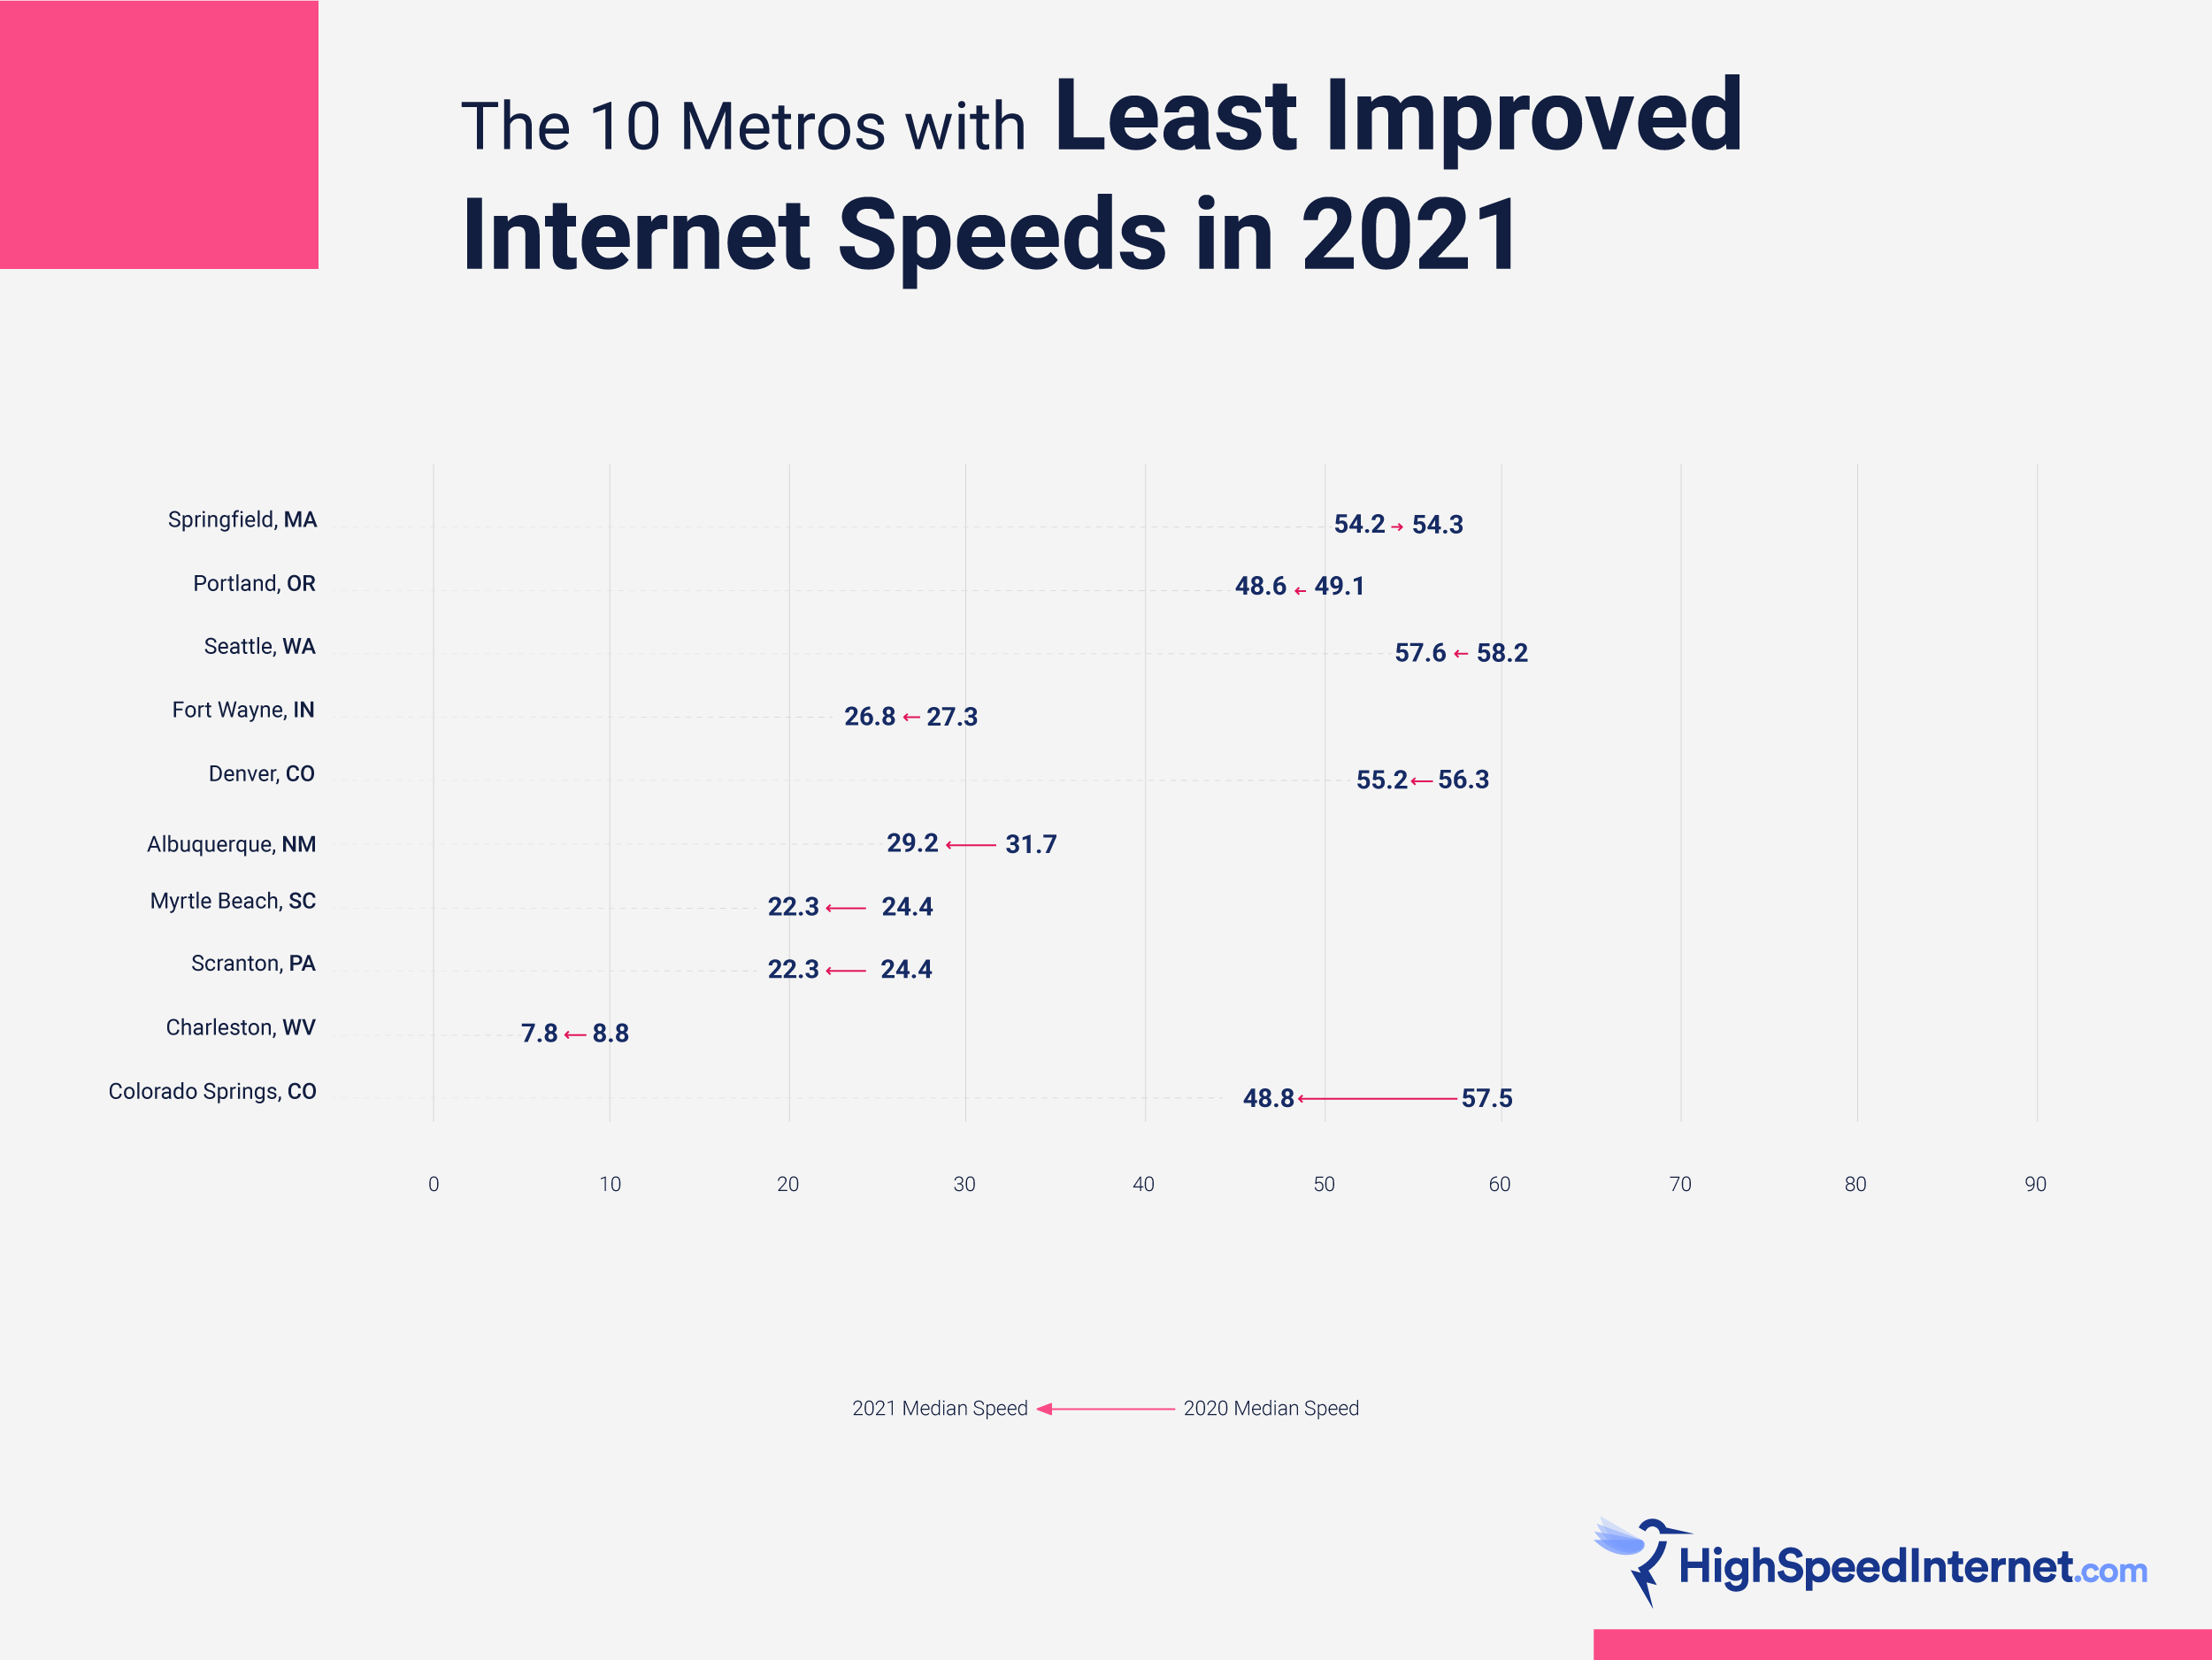
Not all American cities saw increased speeds last year, but generally drops in speed weren’t as drastic as increases. Average speeds in Colorado Springs, Colorado, went down 15% from 57 Mbps to 49 Mbps, while Charleston, West Virginia, saw median speeds drop 11% from 9 Mbps to just 8 Mbps.
| Metro Area | Median download speed in Q1 of 2020 (Mbps) | Median download speed in Q1 of 2021 (Mbps) | Change in download speeds from Q1 of 2020 to Q1 of 2021 (%) |
|---|---|---|---|
| Colorado Springs, Colorado | 57.5 | 48.8 | -15.10% |
| Charleston, West Virginia | 8.8 | 7.8 | -11.40% |
| Myrtle Beach, South Carolina | 24.4 | 22.3 | -8.60% |
| Scranton, Pennsylvania | 24.4 | 22.3 | -8.60% |
| Albuquerque, New Mexico | 31.7 | 29.2 | -7.90% |
| Denver, Colorado | 56.3 | 55.2 | -2.00% |
| Fort Wayne, Indiana | 27.3 | 26.8 | -1.80% |
| Seattle, Washington | 58.2 | 57.6 | -1.00% |
| Portland, Oregon | 49.1 | 48.6 | -1.00% |
| Springfield, Massachusetts | 54.2 | 54.3 | 0.20% |
Shopping around for new internet?
Enter your zip code below to see which providers are available in your area.
Methodology
Our results include proprietary speed tests from February 1, 2020, to March 16, 2021. We filtered out incomplete, duplicate, and cellular phone data to see what most people worked with on their laptops, desktops, and home-connected devices.
We used a total of 1.3 million results generated from our internet speed test tool for our rankings.
We ranked the top 100 largest metros (according to the FCC) as the fastest and slowest for mean average internet speeds in the United States.
We omitted Knoxville, Tennessee; and Jackson, Missouri due to missing zip code data for those metro areas.
Sources
- FCC, “The 100 Largest Metropolitan Statistical Areas (MSAs).” Accessed May 7, 2021.
- Statistical Atlas, “List of Zip Codes per Metro.” Accessed May 7, 2021.
Author - Trevor Wheelwright
Trevor's written professionally for five years for editorial publications and retail/e-commerce sites. He lives in Salt Lake City and enjoys photography and making music in his spare time, or you can catch him on your local dance floor bustin' a move.
Editor - Cara Haynes
Cara Haynes has been editing and writing in the digital space for seven years, and she's edited all things internet for HighSpeedInternet.com for five years. She graduated with a BA in English and a minor in editing from Brigham Young University. When she's not editing, she makes tech accessible through her freelance writing for brands like Pluralsight. She believes no one should feel lost in internet land and that a good internet connection significantly extends your life span.
Related Posts